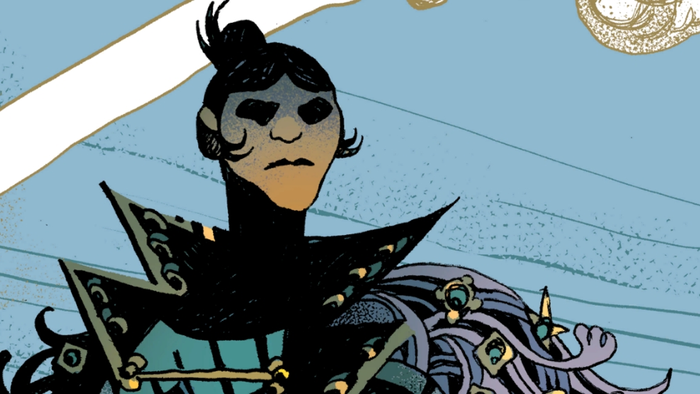
|
If we begin to use level geometry to reduce the amount of possible Steiner points, we are beginning to ask much more of the player. By giving them fewer options (Figure 26), we are asking the player to exercise better strategy than the other players on the map. The upside to this is that players who do well in this environment will take much more satisfaction from its successful completion, as they perceive the lack of options to be indicative of a more complex problem. To demonstrate how a reduction in Steiner points relates to increased difficulty, we need look no further than the Steiner tree problem that we see in the lower, east quadrant of the Fallout 3 overworld (see Figure 27.)

 Figure 27 (Click for larger version.)
Spatial navigation problems in the early parts of Fallout 3 are negotiated via simple spanning trees where you have many possible Steiner points. This is most noticeable in the areas to the south of main Vault as this is the first (and easiest) part of the map that the player is expected to explore. As difficulty increases, though, these Steiner points are vastly reduced; this can be seen in the subway system of DC, which the player encounters later in the main quest of Fallout 3.
A Practical Implementation
So far we have examined the basic principles of graphing theory and applied this to the analysis of a number of commercial examples, but how does graphing theory stack up as a tool to concept game spaces? The following is an example of a practical implementation of the theory of molecule design created by Nassib Azar.
In this example, a molecule concept is tested, implemented, and refined in order to create a balanced, multiplayer space, which despite its simplicity, offers players with a significant amount of interesting strategic possibilities to explore.
The core idea Nassib decided to explore was a map design which had three layers of experience, represented as three concentric circles. The game space is a deathmatch style map within the default game type of Unreal Development Kit. The outer layer comprises low intensity zones designed to "feed" players into the innermost section of the game space.
For the purposes of this design, "intensity" is measured by the amount of players actively trying to kill each other within each zone. Figure 28 is one of the preproduction sketches of the map. This diagram explores how choke points, intersections, spawn points and weapon pickups could be used to increase the intensity of the play experience as the player nears the center of the map.
 Figure 28
After some initial paper prototypes and feedback, the core idea of three concentric play spaces of varying intensity eventually developed into a more concrete molecule which defines the space as a whole. Figure 29 is an iteration of the early concept. In this iteration, we still have the same set of concentric circles representing intensity of play; however, edges have been added to describe how the outer sections feed into the middle.
To achieve this goal, Nassib applied the notion of Compression and Funnelling, a simple tool which looks at how forcing the player around a game space using various game elements can create heightened emotional states. In Figure 29, each edge represented additional vectors of compression on the nodes they led to. In the case of this example, the nodes represented spaces for conflict; the more the edges leading into a node the higher the compression on that node (and as a result, the higher the intensity of game experience). In this application, node size was used to represent increased compression, and subsequently, intensity of play.
 Figure 29 (Click for larger version.)
Although the application of molecule design is meant to create a distinction between play experience and level geometry, Nassib chose to explore whether pure geometrical representations of space have inherent player experience value. The hexagonal attributes of Nassib's molecule prototypes were worthy of further investigation. The question was: Would the molecule translate to actual level geometry and still retain the original design intent?
The prototype molecule used to define the overall game space went through a number of iterations in the form of grey box levels developed within UDK. It was clear through prototyping that the experiment had merit; the intensity of the player's experience increases as they work their way towards the center of the map. Nodes became generic play spaces (rooms) and edges became corridors that would feed into these spaces.
Figure 30 is one of the more advanced iterations of the grey box. It shows the implementation of the original molecule into a playable space. During testing, it was found that for intensity of play to increase, the room sizes needed to increase in order to accommodate the increased play intensity.
Room sizes are designed to create the most optimal zone sizes for the desired amount of play intensity. The original molecule design translated well in this regard. Play zones became progressively larger as they player moves towards the center of the map, yet the zones are also small enough to force the players into close proximity combat, hence increasing play intensity.
 Figure 30
In order to create a syphoning of players towards the center of the map, a molecule was designed to aid in the placement of various weapon pickups. There are two main molecules used to define token placement. Weapon pickups were embedded in a molecule that forced the player to move quickly towards the center of the map. Health pickups were embedded in a molecule that forced the player to explore the circular boundaries of each play zone. The differing nature of these two molecules not only adds to creating clearly defined and different movement tactics for offensive and defensive play, but also aids spreading play over the entirety of the map rather than the central most zones.
 Figure 31 (Click for larger version.)
Figure 31 breaks down the graphing further. In the close up of the medium node (upper left), a differentiation is made between two different edge types leading into it. Edges 1 and 2 come from the spawn point while 3 and 4 are fed from other medium nodes. This suggests a difference in danger level and is therefore represented by expressing the edges differently. Although the initial design hypothesis suggested that there would be some type of discernable difference between edges one and two AND three and four, it took several revisions of the grey box to observe this hypothesis the real world, seen in Figure 32.
 Figure 32
|
A valuable perspective to have in the tool bag. Thank you. :cheers:
As a note on further research, there is a good case to be made for the idea that a given dominion space can have a formal, quantifiable difficulty rating assigned to it based on metrics and completion rates -- in fact, multiple axes of analysis could give playstyle differentiators as well. With that, you could at a minimum get a good way to assess your levels' difficulty, and given sufficient data and some AI programming, even in theory build agents that can tell you that same info without needing to spend playtesters on it.
I am fairly sure some of those ideas, as well as some of those in the article, were presented by Andrew McLennan at GDC a few years ago.
I have been taking an interest in some of the 3D engineering applications and how they are used to model and analyze thermal dynamics; specifically things like exhaust flow and heat distributions.
I would really like to try and see if game levels can be analyzed in the same way, basically simulating what would happen under "normal" conditions and leaving the play testers for the emergent stuff :)
I'll be sure to write a follow-up to this if when I figure out how to do this!
I'm not sure if they are aware of it, but the development of Portal 2 heavily depended on the type of level design you are working with here. Specifically, they created individual levels with the idea that certain areas would be linked (either physically or just visually). The advantage they gained by designing
They then used portals to link the areas together. The final step in the level design was to stitch the various pieces together, add bridging geometry where appropriate and remove the portals.
I'm currently working on a project for which I've taken a similar level design strategy as what you mention here. That is, using directed graphs that represent the moment to moment player experience (and not just the level geometry). We too are working in UDK and I've found extensive use of the UTPortal class for this purpose. The directed graphs have been helpful to estimate player performance within a setting thus defining a good baseline for some of the goals and game balance issues well before testing has begun.
Finally, this method lends itself to a fractal-like expansion fairly readily. That is, since each of your nodes is representative of a player experience, it follows that the entire graph is representative of a larger player experience. Those larger player experiences can then, just as easily, be linked in a directed graph. If you were really clever, you could then force a certain consistency to the experience of your game by having the large experience graph be similar to the smaller experience graph which in turn is similar to an instantaneous experience graph. I recently did a study of Cyan's "Myst" along these lines which I would be happy to share with you if you are interested in doing some follow up to this.
This is way too long a response, but you hit upon a combination of subjects I'm intensely interested in. :)
In regards to the math - accessibility of these models was really high on my agenda. Plus, I rely on Jesse Schell's 10th rule of what game designers need to know about math and probability :)
What you mention in regards to your UDK project sounds really interesting. One of my students (http://www.gamenbrain.com/) who used this model created a recursive space death match map. What I really like about it is for all intensive purposes it is a single, arena space. But as you mentioned, the portal class in UDK allows this space to be much, much more.
I'll add more of a reply when I get a chance to use a real keyboard!
This sort of goes in with what you were saying about the edge lengths earlier in the paper which confused me earlier. That is, normally in graph theory we don't care too much about edge lengths, however in computational geometry we do. (More properly, computational geometry falls into computer science, but we are being interdisciplinary here so I'll step a little bit out of my comfort zone.) If the length of an edge represents something like the difficulty of an area in the level setting up a graph this way will help balance the experience. A graph that obeys the Delaunay condition will have a property that all of its triangles will tend towards equilateral (it maximizes the minimum angle of the triangles and the maximum value the smallest angle can have is 60 degrees, which only happens in the equilateral case) and so avoid stretched triangles. Avoiding stretched triangles minimizes long edges, which in turn minimizes inequity in paths through a level. If an area of the game is too hard and optional, players will quickly learn to avoid that area unless you make it worth the time. (For instance, speed runners of Super Metroid always avoid Spore Spawn because killing it takes a long time and it gives a useless reward. So that miniboss would be represented by a long edge and a fairly unattractive node if we were to create a graph of Super Metroid.) That said, there is nothing to prevent a good designer from breaking this rule and creating a truly grueling set of paths if the game design allows for it. (Example there could be the purely optional Red Knight in the first level of Demon's Souls.)
As I'm sure you know because you grouped them, calculating a Voronoi diagram is functionally similar to confirming that a graph obeys Delaunay. That is, connect the centers of the circumcircles you drew and then, where necessary, bisect the outer edge of the triangle (much easier to explain with a drawing). Now, the only thing that springs to mind about how a Voronoi diagram would be useful for level design would be it would start to inform you where level geometry might need to go to restrict player movement and more clearly define the zones of play from your Half-Life 2 example. You can see that Valve did this to an extent by using bridges, tunnels, curved roads and water giving you your figure 12 from figure 11. That said, this feels a little more like something you'd end up doing to fix problems with the pacing of the map after the fact.
I'd be interested to hear more about how you use Voronoi diagrams in level design. I really don't understand it at a deep enough level to do anything great with it.
In regards to games which do this well in 2D space one comes immediately to mind however I haven't played it in about 10 years so I might be remembering it to be better than it was! The game is Another World. It was a really slow paced platformer with rotoscoped animations. The game makes good use of the space by not using scrolling. Instead, each section of the level is represented in a new window. The game space is classified as "Adjacent spaces displayed one room at a time" (Mark Wolf - The Medium of the Video Game).
What is cool about Another world is that each screen is not a node, but rather contains several spatial nodes. For instance, you might be in one screen with two levels, but there is no way to get to the other level in the screen you are currently in. This means that you will need to go to other screens and figure out the spatial relationships for your self. The game play is largely based around this concept, especially in the later levels.
Raymond is also on the money. According to Koster, humans are pattern recognition monsters! We get great pleasure from discovering patterns and using them to preempt risk & reward scenarios. This is why I really like the molecule approach because it immediately lends itself to this human desire.
But I have one little problem with the AOEs and their possible overlap in figs. 10+. The AOE you defined to represent "intensity of play". Meaning, the bigger the circle, the more intense the challenge. But this means that, when you combine it with a physical map like in the HF2 maps, the overlap of AOE doesn't mean anything. The radius of the circle is a measure of play intensity, while the distance between the circles is a measure of physical distance. You can just draw smaller circles without changing their meaning, because you can anyway only compare the AOEs with each other, but not with the edges.
Of course, if you use the AOE (as you probably did here) to show the actual, physical areas of activity (maybe that would be a good name for it: AOA), then your method works.
I hope I made myself clear :)
The article did make me think about the problem of procedurally generated combat maps though and my initial notion involves pitting AI driven teams against each other on a variety of maps generated for their atmosphere and credibility - i.e. the algorithm's sole concern is the creation of, say, multiple war-torn Beirut-style maps. Due to the inevitable asymmetry to these (as a bunch of ruined streets wouldn't happen to have convenient reflectional symmetry for the purposes of deathmatch balance), you would have to limit your battles to Attrition, Bomb, Conquest, Duel, or Espionage with one team being the attackers and the other attempting to hold onto their defensive position. The game profiler could adjust the equipment, armament, transportation and number of players independently for each team in order to rebalance the game if the defenders used their "hill" (or somesuch topographical, or topological, advantage to their strategic advantage), it could make the attackers more numerous, or allow for fewer 'tickets' on the defenders side, or none: letting them get permanently eliminated by only giving them one life, whilst the attackers drew on a substantial pool of respawn tickets, Alamo style, some of which could be taken by deceased defenders who were tired of being neutral observers.
Another, perhaps more pragmatic course is to leverage User Generated Content, something which has already proven itself with the Halo 3 Forge and over seven million maps made for Little Big Planet.